
Volunteer Recruitment Research & Experience Design
CASE STUDY: Volunteer Recruitment Research & Experience Design
Cape Fear Surfrider Foundation | Wilmington, NC
THE RESEARCH QUESTION
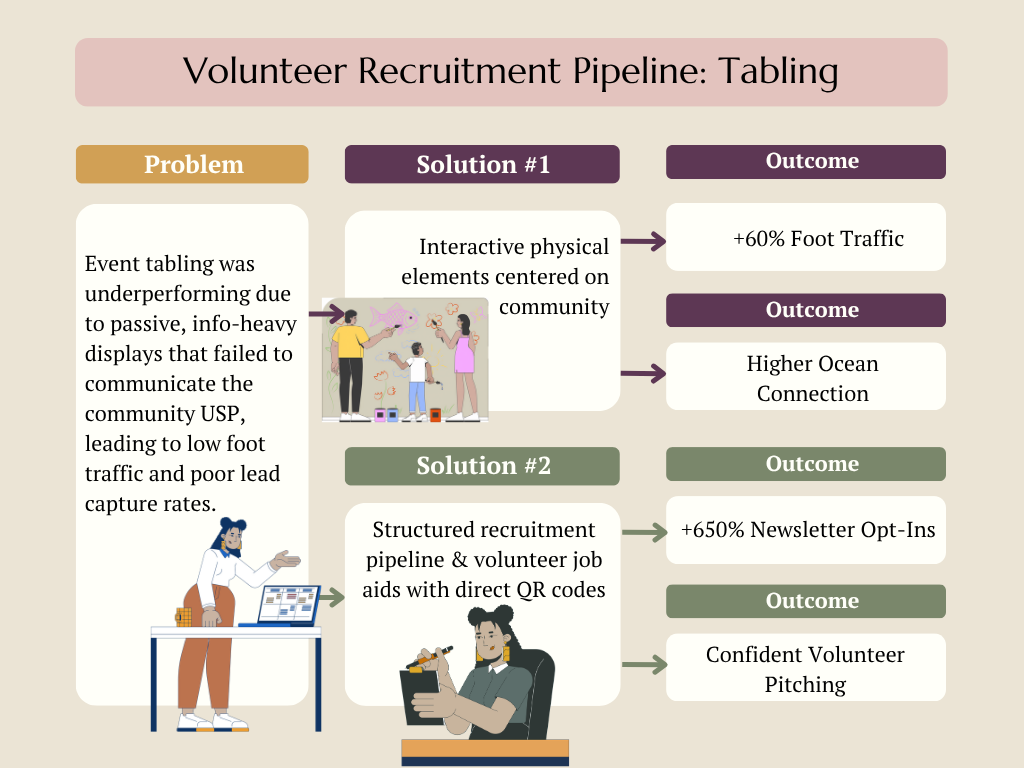
Volunteer recruitment at tabling events was underperforming. Before redesigning anything, I needed to understand where the gap was between what the organization was communicating and what was actually drawing people in - and why potential volunteers were walking past without stopping.
WHO I RESEARCHED & HOW
Conducted interviews with the Board to understand organizational recruitment goals and what success looked like from a leadership perspective
Shadowed live tabling events to observe foot traffic patterns, volunteer behavior, and where conversations were breaking down in real time
Interviewed current volunteers to understand what had motivated them to join and what language they used to describe the community to others
Spoke with potential leads at events to understand what drew their attention and what made them hesitant to engage
Collaborated with the Communications Coordinator to pull and review historical event data, including past newsletter opt-in rates and foot traffic patterns, to establish a baseline and identify where the existing approach was falling short
WHAT I FOUND
The organization's strongest differentiator was community - people joined to connect with like-minded people who cared about the ocean, not just to do beach cleanups
Nothing on the existing table communicated that community USP visually or experientially - the setup was informational rather than inviting
Volunteers were inconsistently prepared to answer questions about specific programs, creating friction at the moment a potential lead was ready to engage
Passive displays were not generating stopping behavior - people needed a reason to physically interact with the table to slow down long enough for a conversation
Baseline data confirmed that existing opt-in and foot traffic numbers were significantly below what the organization needed to sustain its recruitment pipeline
WHO I WORKED WITH
Collaborated with the Board, the Communications Coordinator, and frontline volunteers to align findings with event logistics, budget constraints, and the organization's broader recruitment pipeline strategy.
WHAT I RECOMMENDED
Redesign the table experience around the community USP rather than program information - lead with belonging, not tasks
Add interactive physical elements to create stopping behavior and activate emotional connection to the ocean before asking for any commitment
Develop a volunteer job aid with direct QR codes and key program information so volunteers could answer questions confidently without memorizing details
Integrate the tabling experience into a formal awareness stage of the recruitment pipeline, followed by a structured welcome email sequence to nurture leads captured at events
Add low-friction newsletter sign-up incentives to convert foot traffic into trackable leads
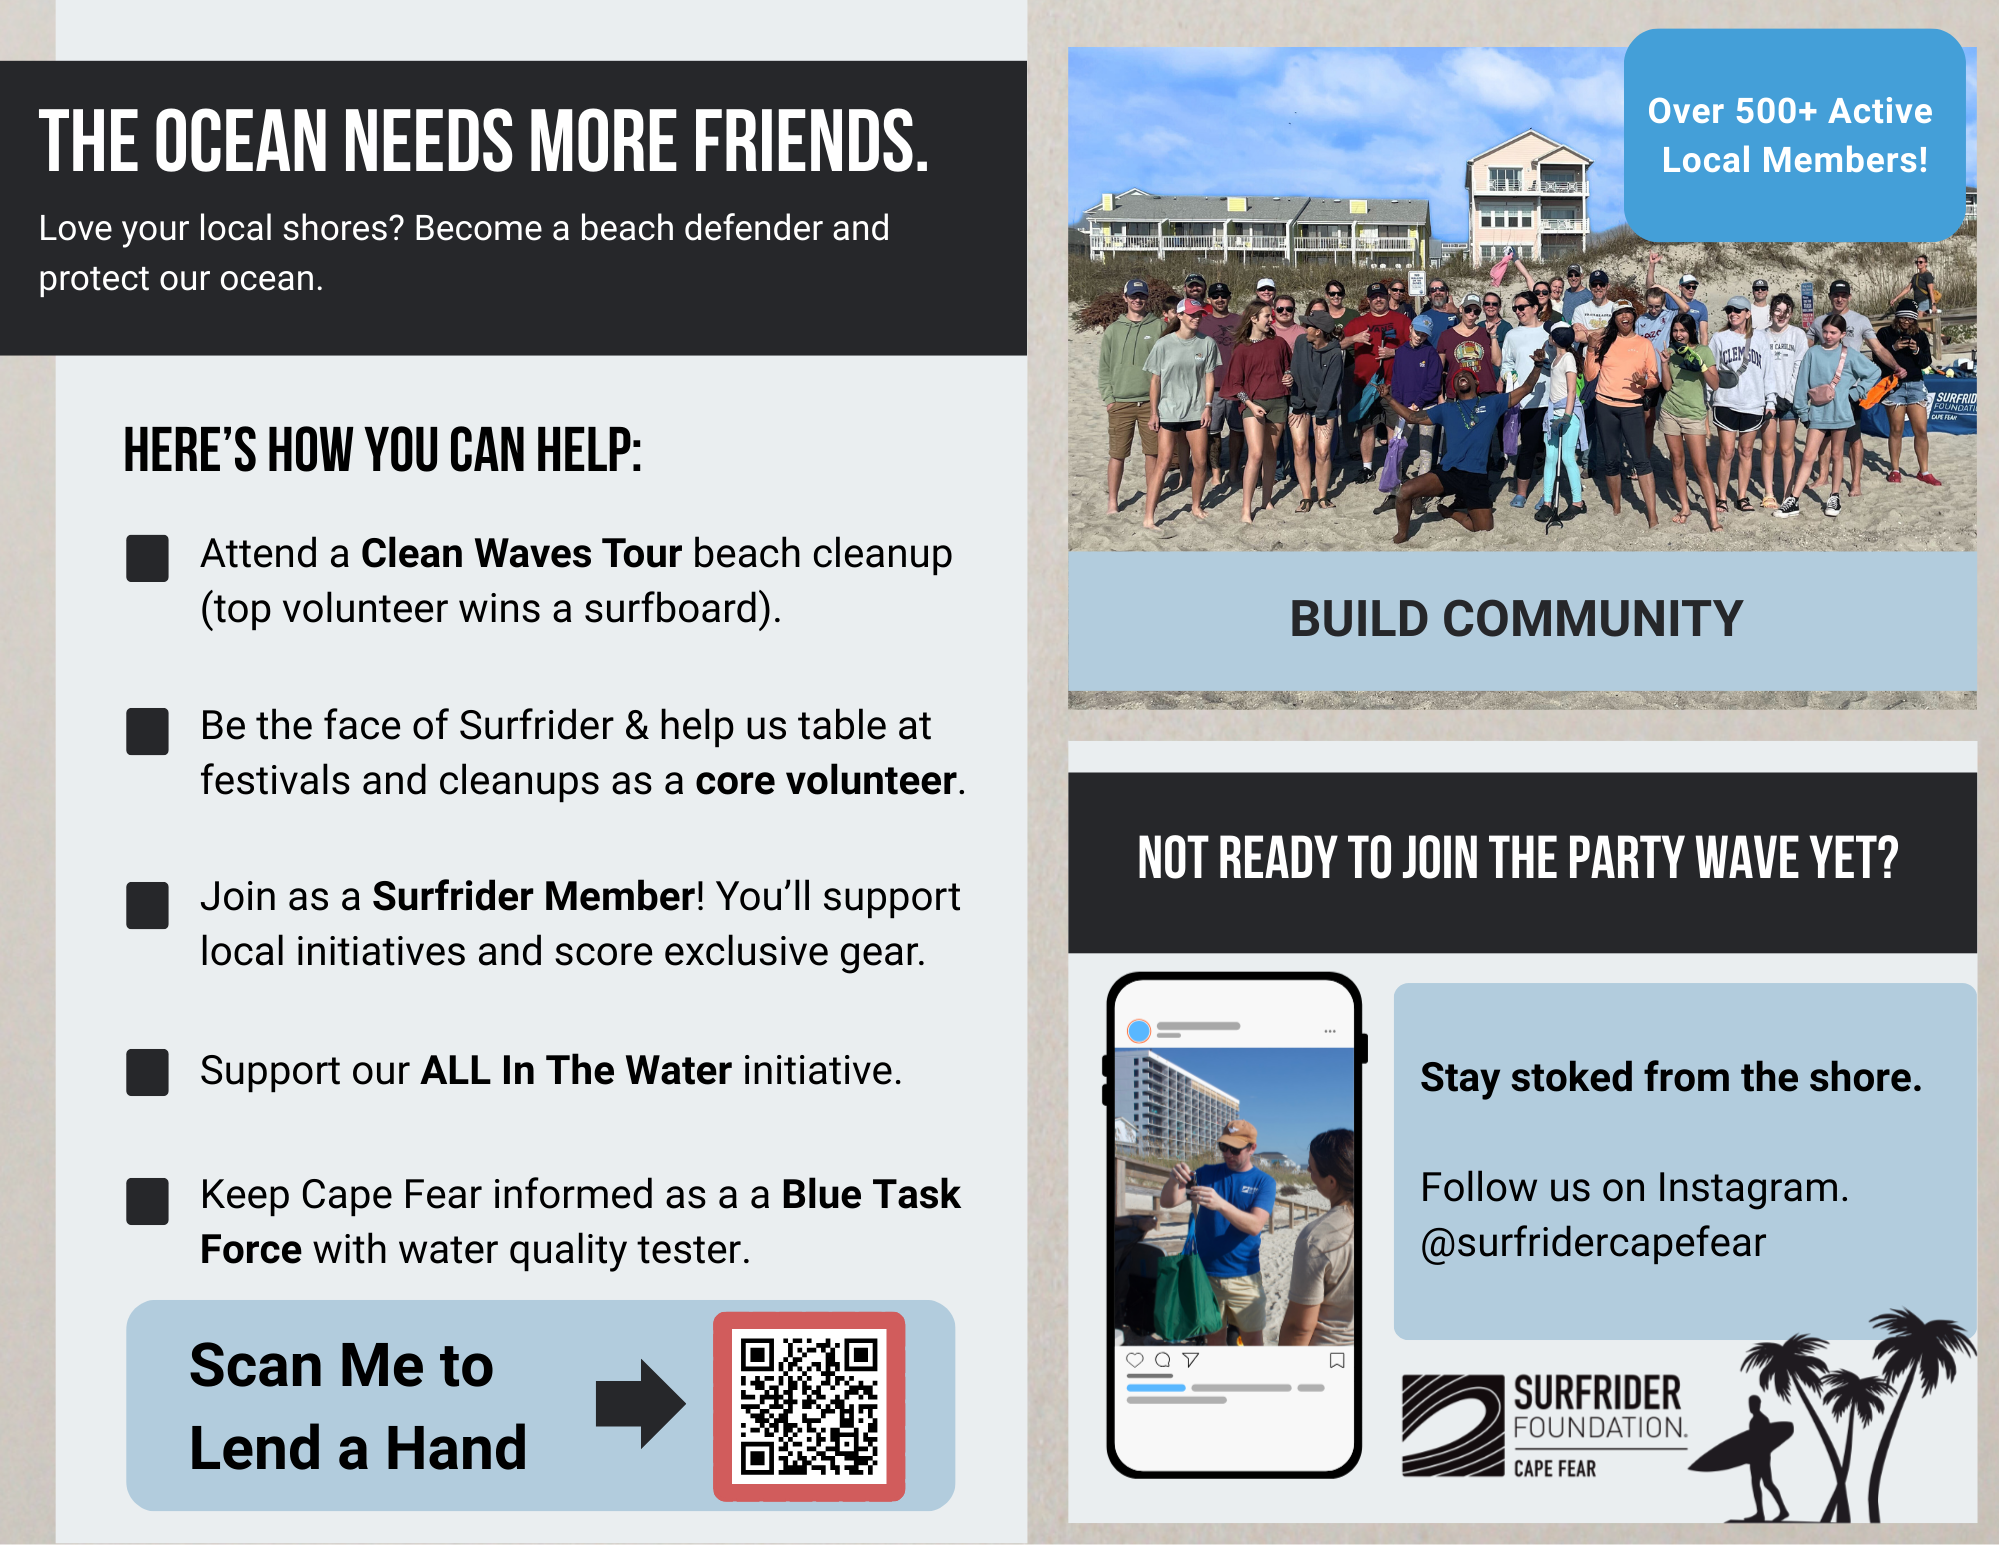
Easy to navigate one-page informational flyer.
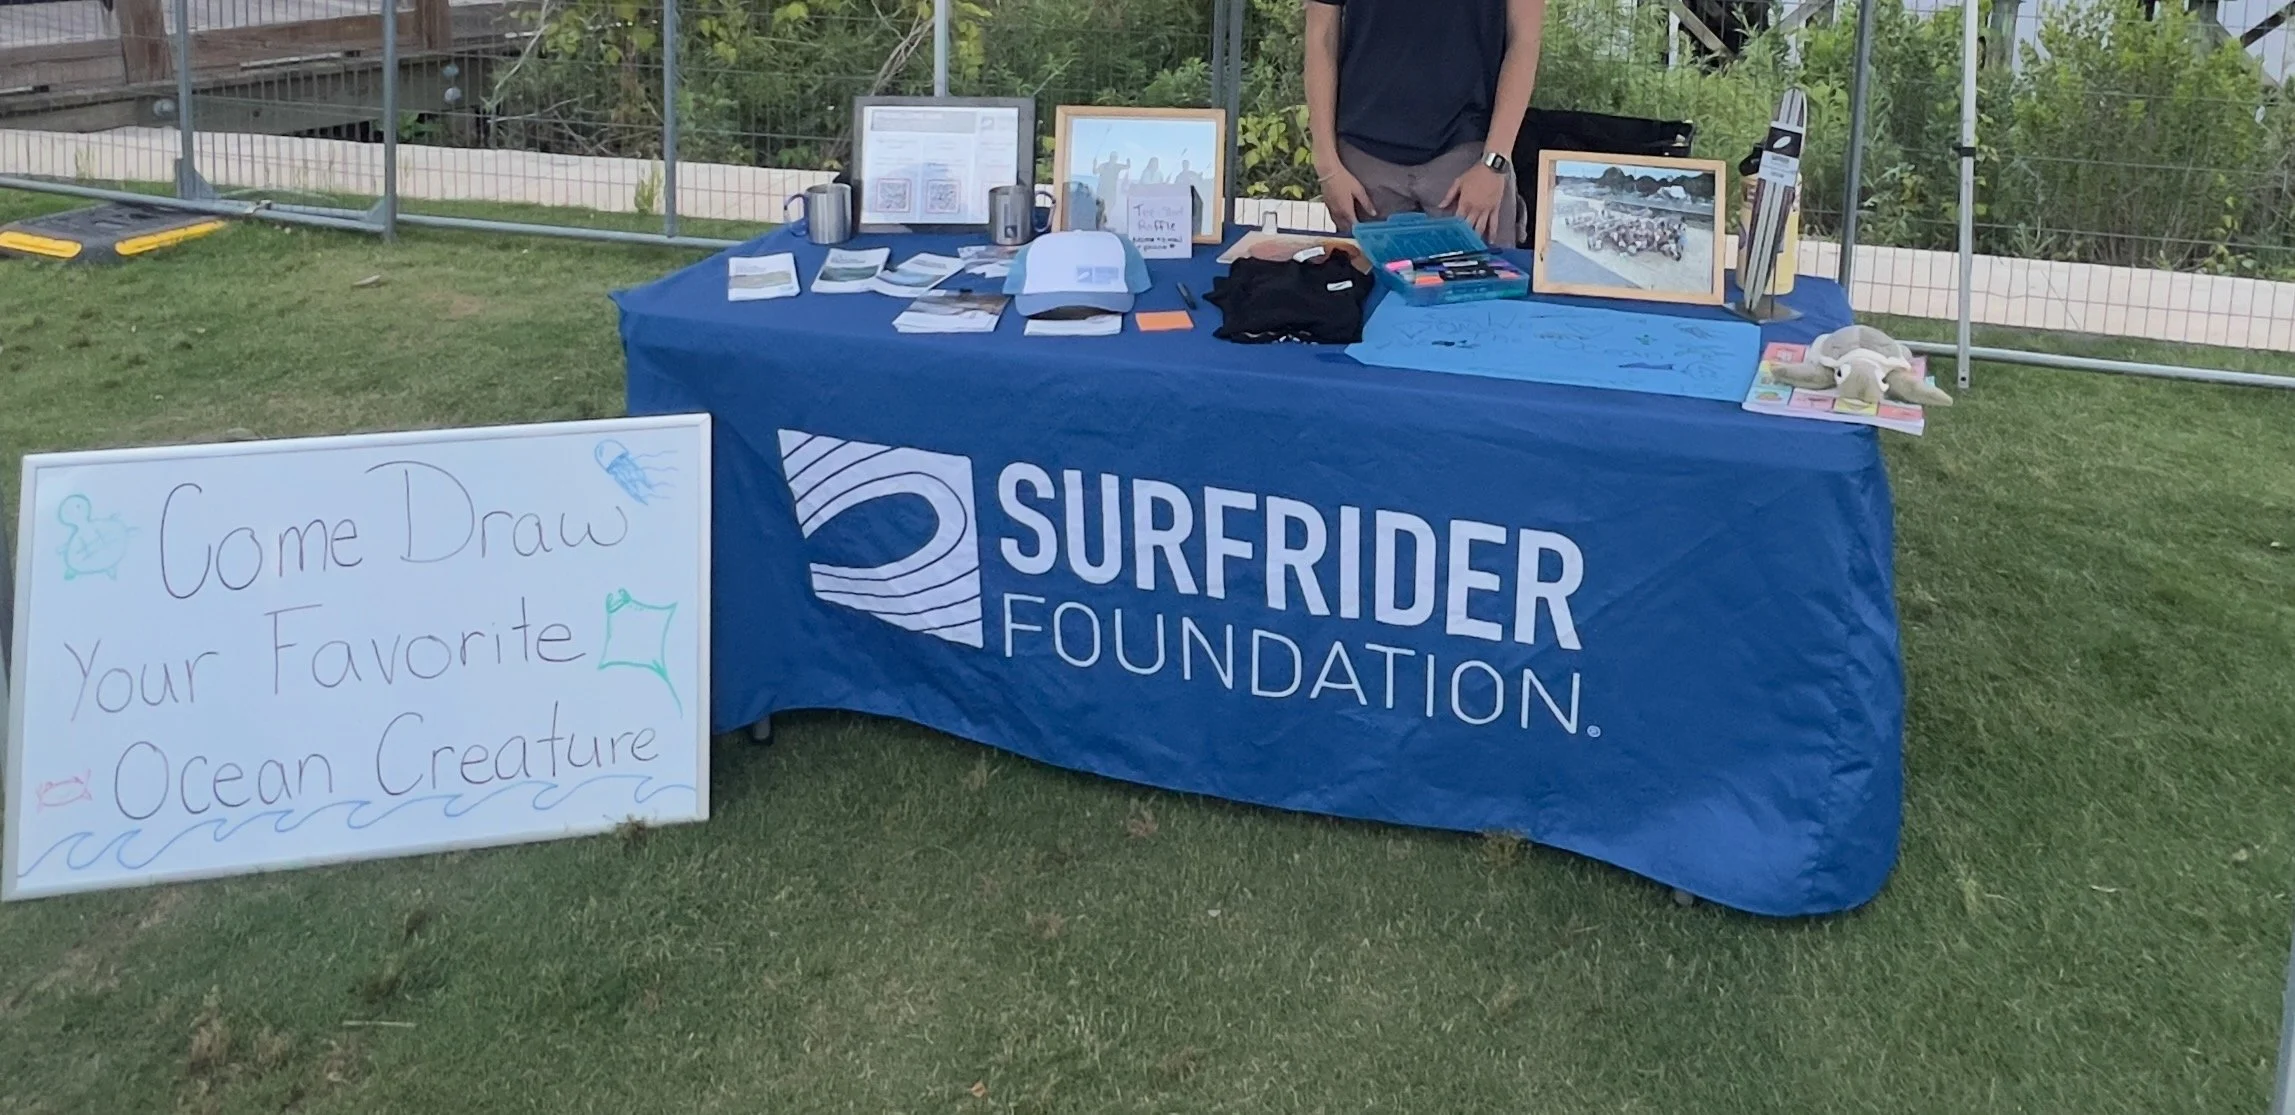
CTA stationed in front of the tabling setup.
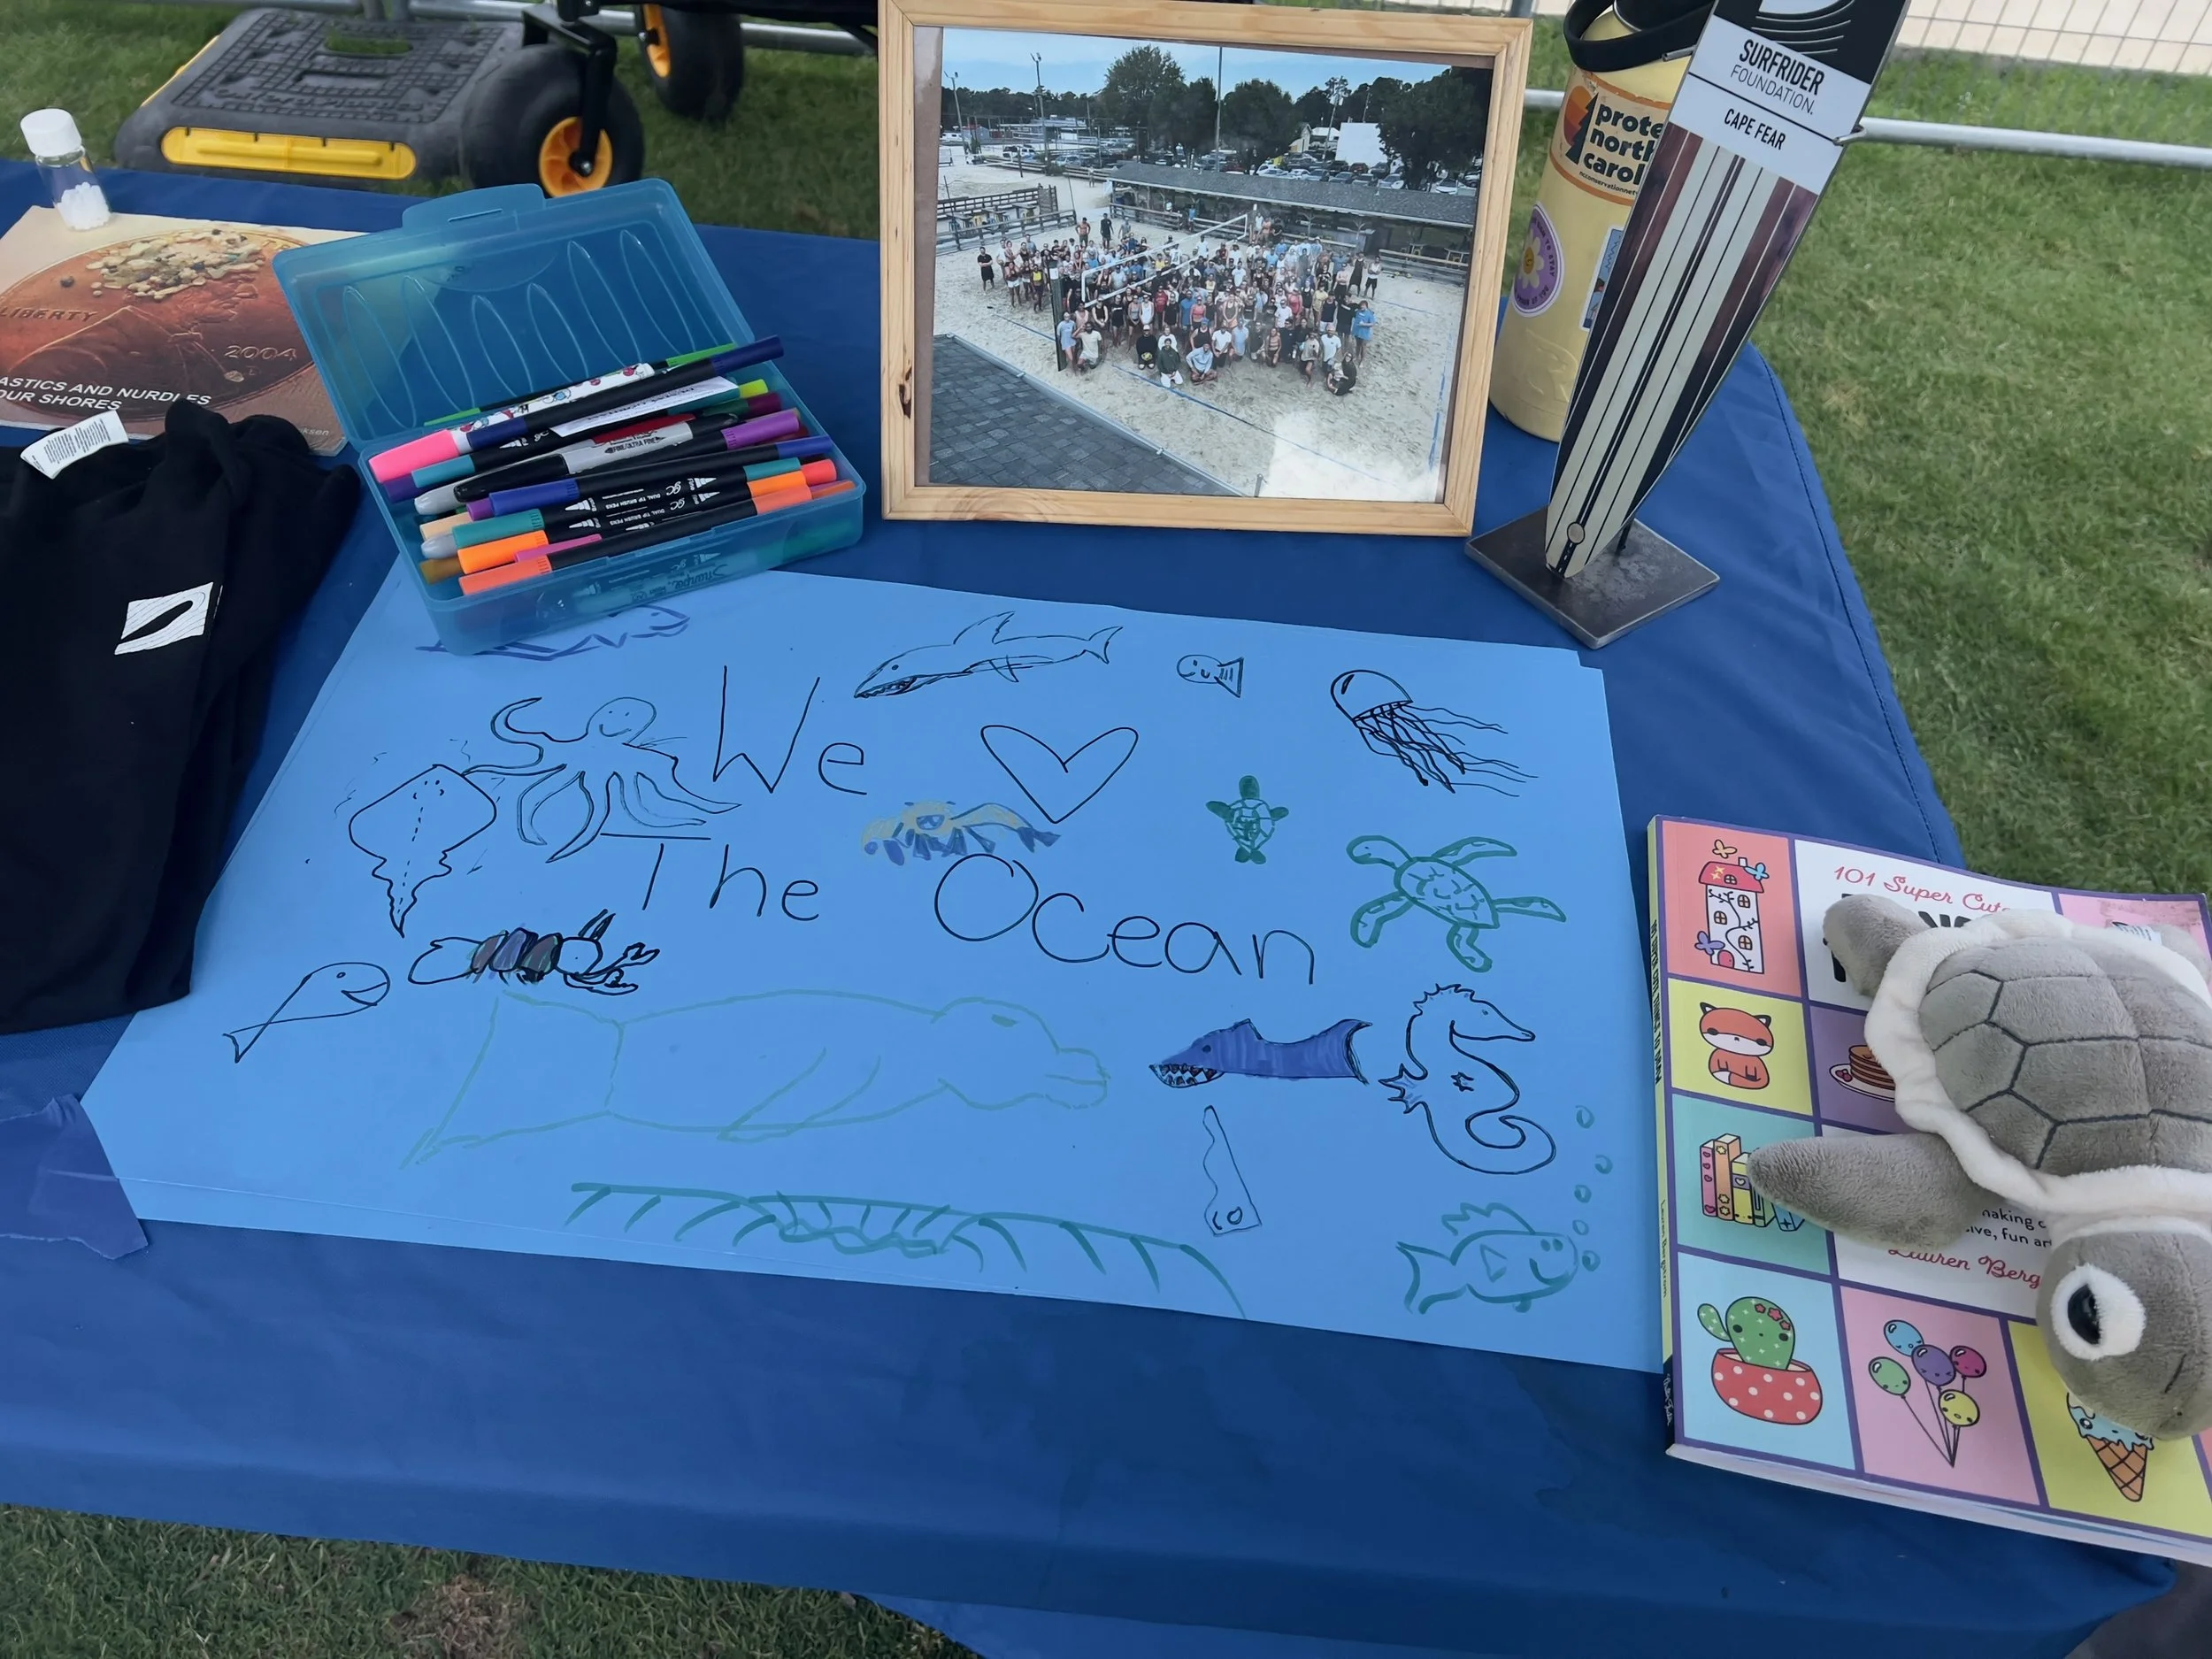
Interactive activity for potential volunteers to participate in.
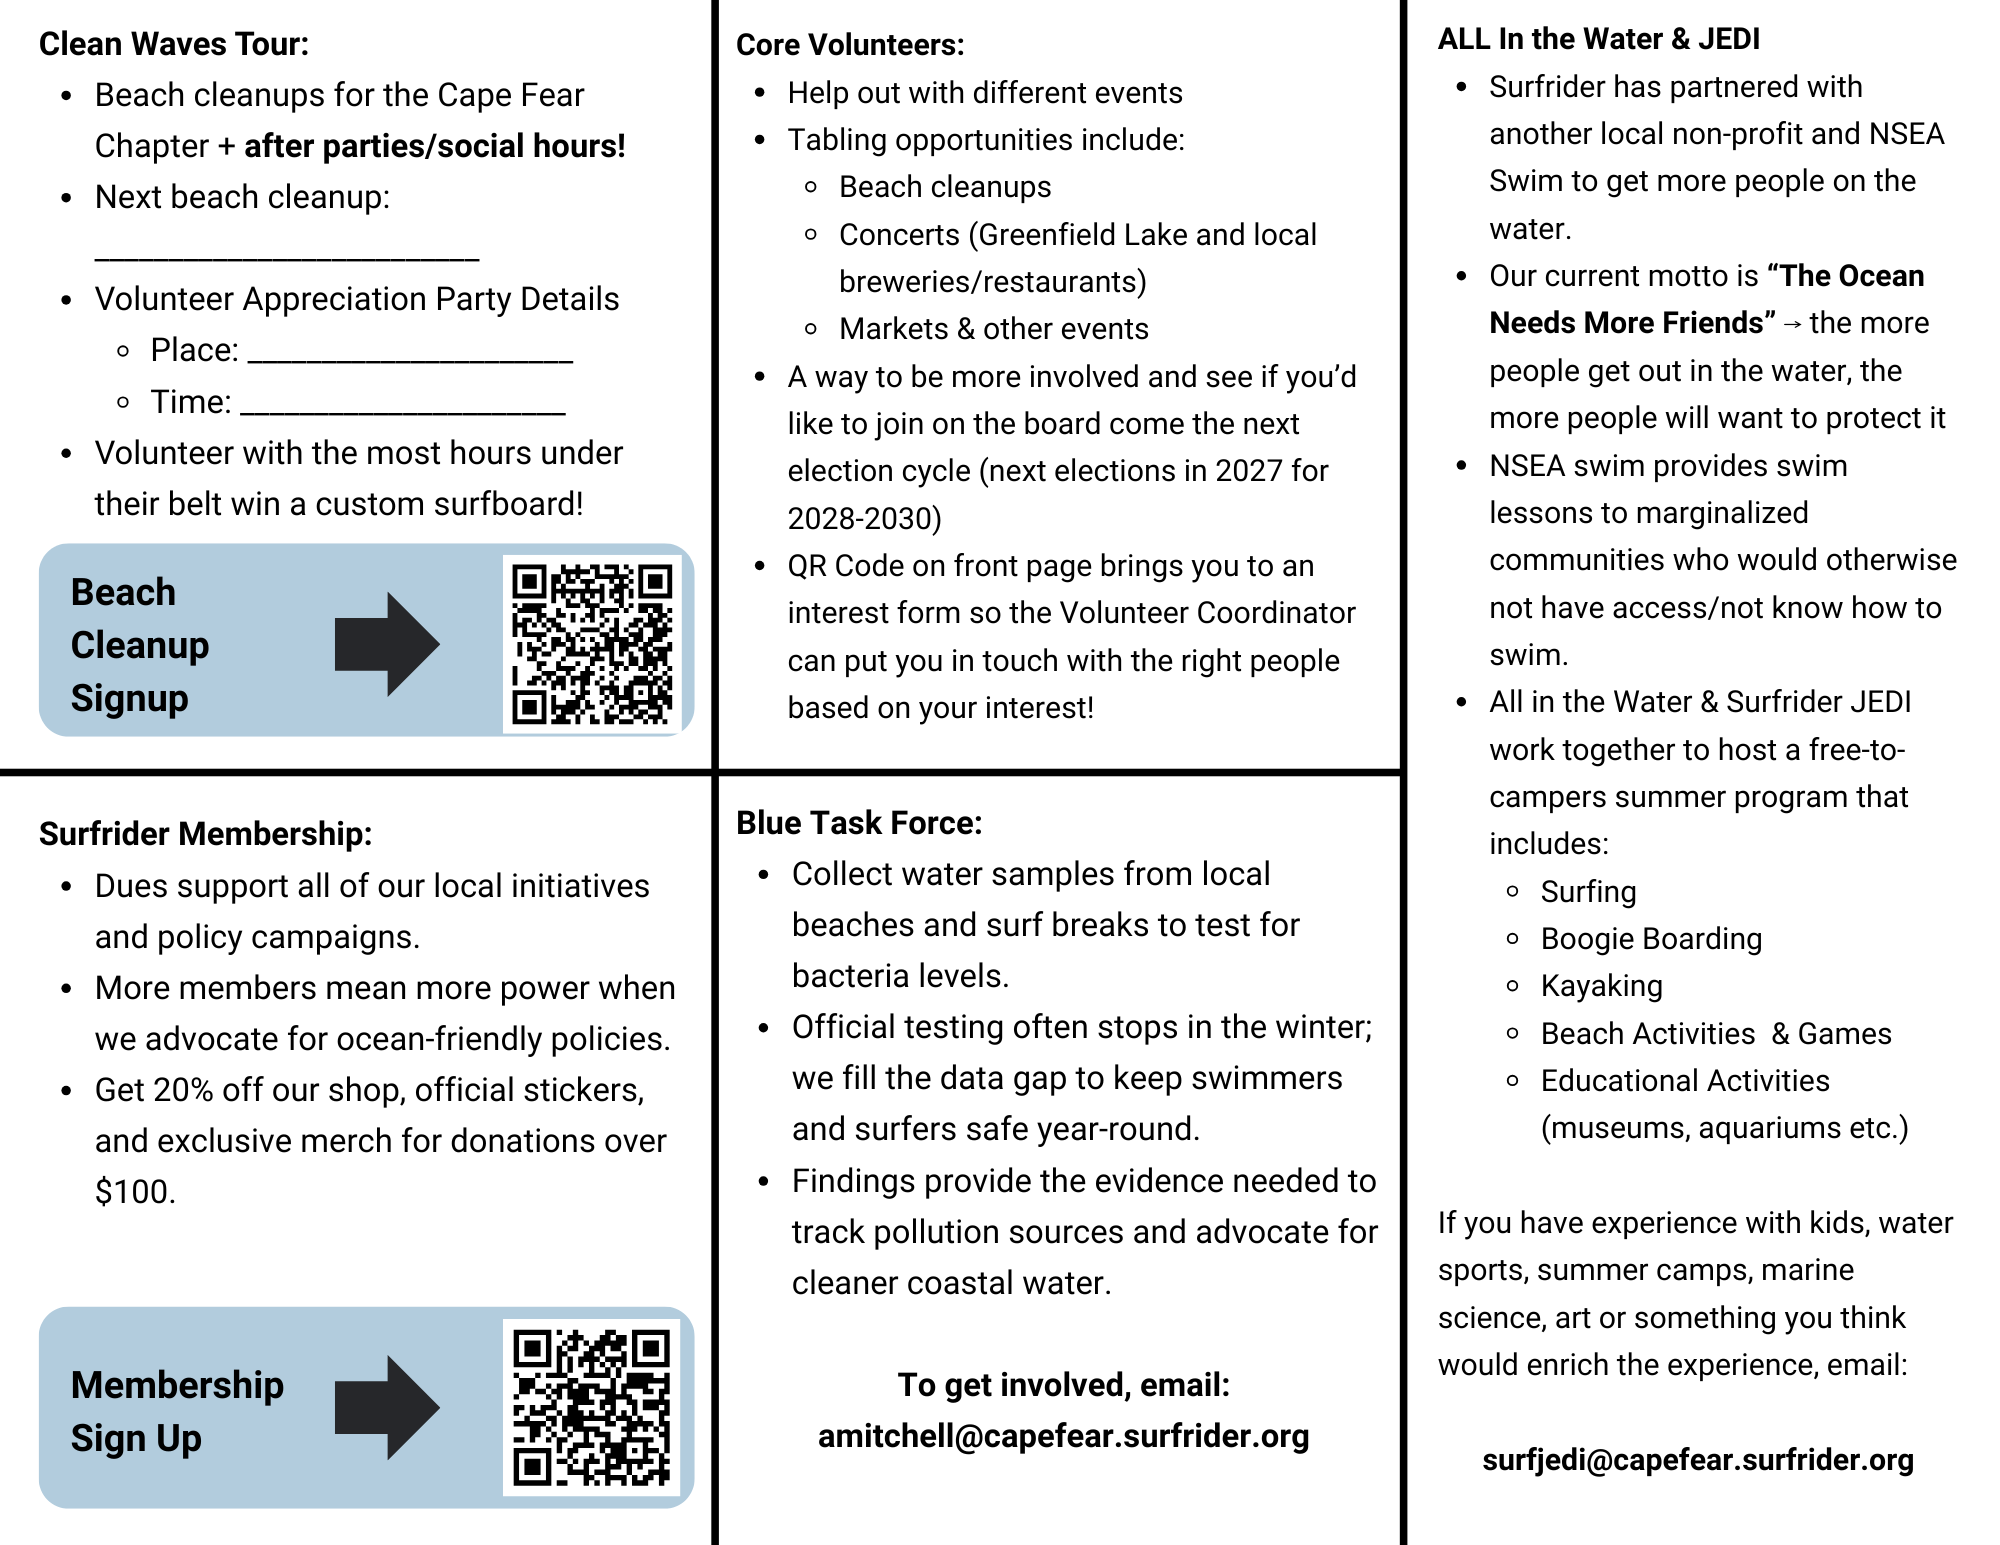
Cheat sheet for tabling volunteers.
WHAT CHANGED
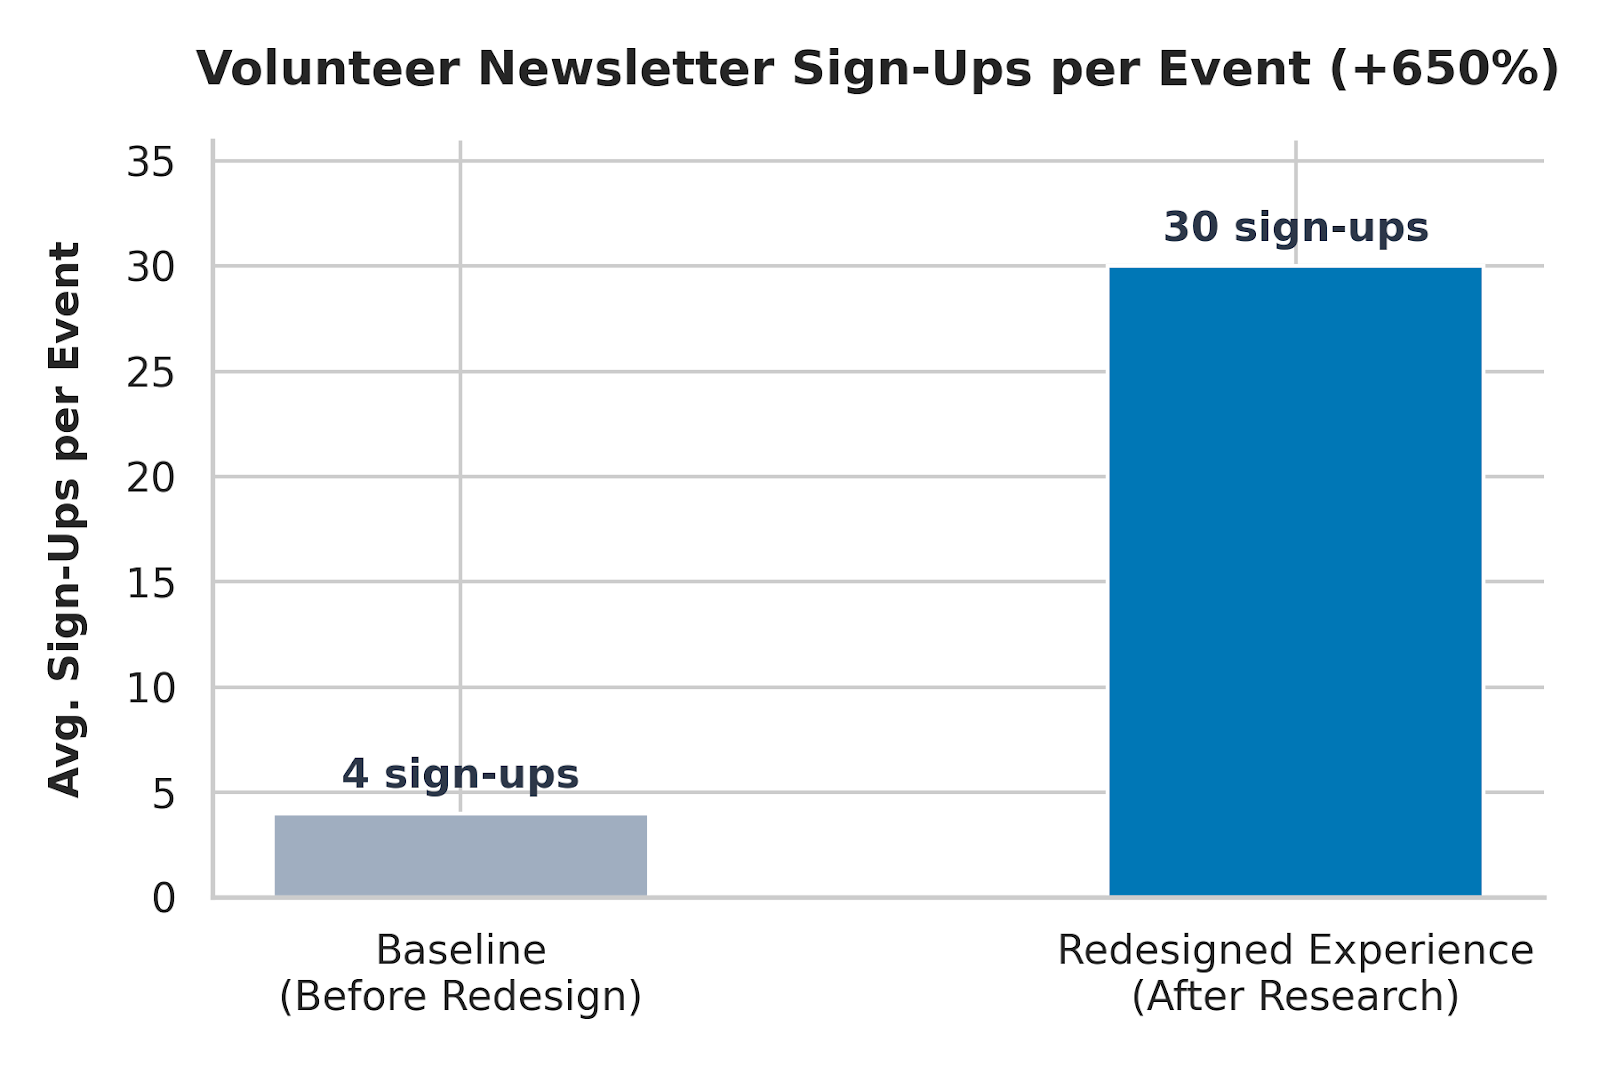
Compared against the baseline data gathered before the redesign, foot traffic increased by 60% and newsletter opt-ins increased by 650% over the course of several summer concerts. The redesigned experience positioned tabling as the awareness stage of a formal volunteer recruitment pipeline - capturing names and emails that fed directly into a welcome email sequence designed to move leads from initial interest to active participation. The volunteer job aid reduced inconsistency in how programs were communicated, giving frontline volunteers confidence and ensuring potential leads always got accurate information regardless of who they spoke with.
"You can tell Emily truly cares about our oceans - but she also has this amazing ability for jumping into the chaos and making sure everything works out. She actively supports programs that protect our waters and advocate for equitable access, always leading with care and integrity." - Tiffany Cook, All in the Water Coordinator, Cape Fear Surfrider Foundation
WHAT I'D DO DIFFERENTLY
I would have tracked conversion rates beyond newsletter sign-ups - specifically how many tabling leads moved through the welcome email sequence and became active volunteers. The awareness stage metrics were strong, but connecting them to downstream retention data would have given a fuller picture of pipeline effectiveness.
METHODS & TOOLS USED
Stakeholder interviews, observational research, user interviews, historical data review and baseline analysis, behavioral data tracking, foot traffic and opt-in measurement, job aid design, pipeline stage mapping, welcome email sequence design